Financial Data Hub & Exporter
An analytical dashboard designed to help users get historical financial data efficiently and accurately.
Overview
Financial Data Hub was born out of a concrete technical need: the growing restrictions of traditional financial platforms were making it harder for analysts and finance students to extract reliable time series for econometric work. This dashboard solves that by combining smart data retrieval, professional-grade visualization, and a download engine purpose-built for Excel compatibility — all in one coherent interface.
Key Features
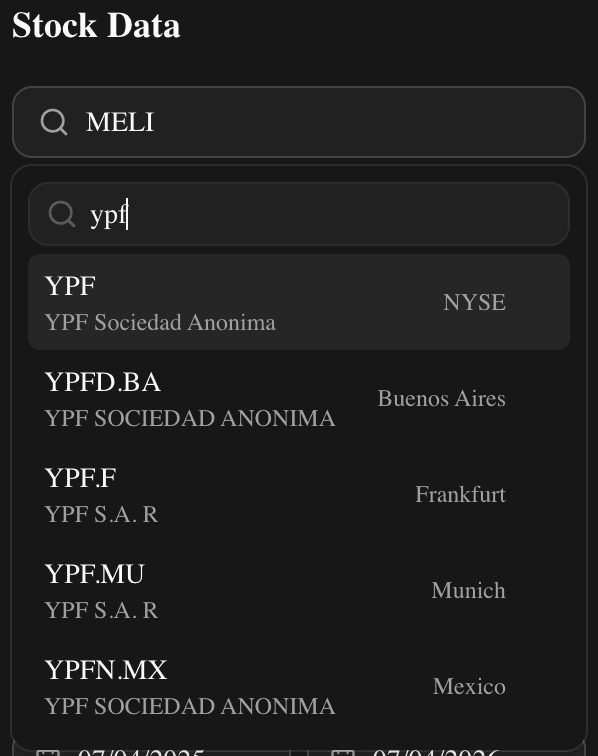
Real-Time Intelligent Search
A centralised search bar with autocomplete and debouncing lets users locate global assets instantly. It validates data availability and IPO dates upfront, preventing erroneous queries before they happen.
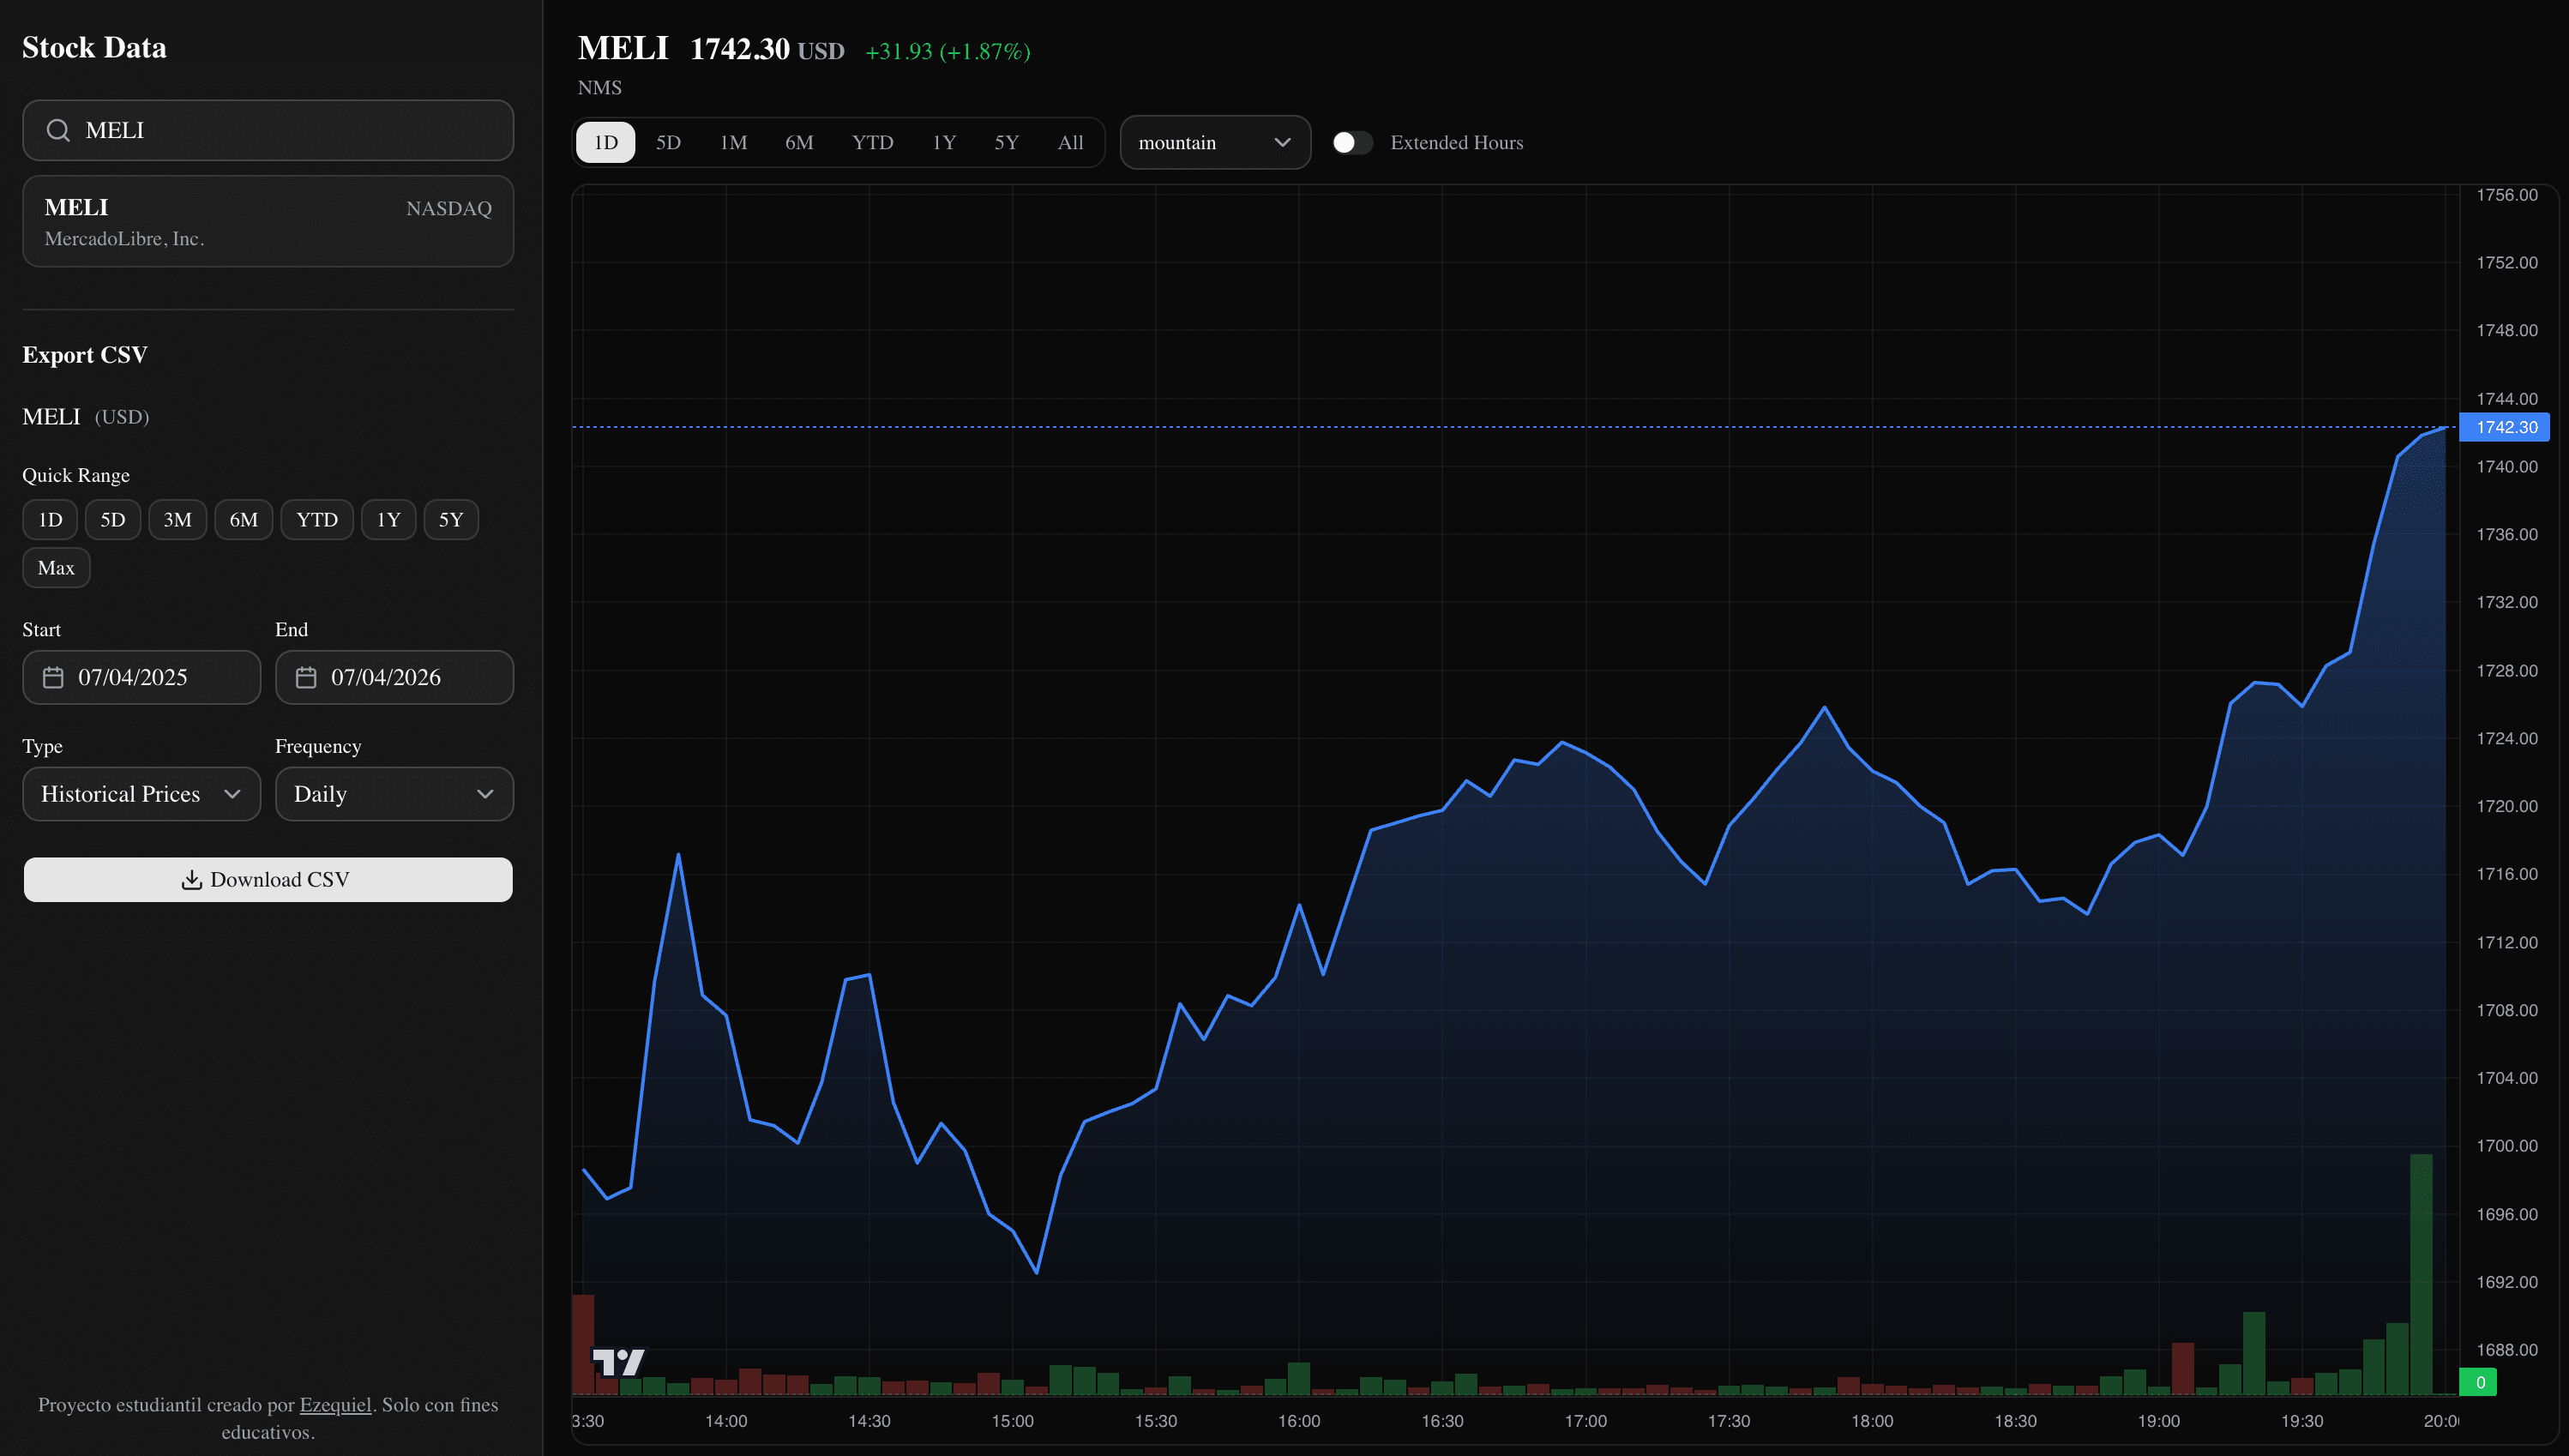
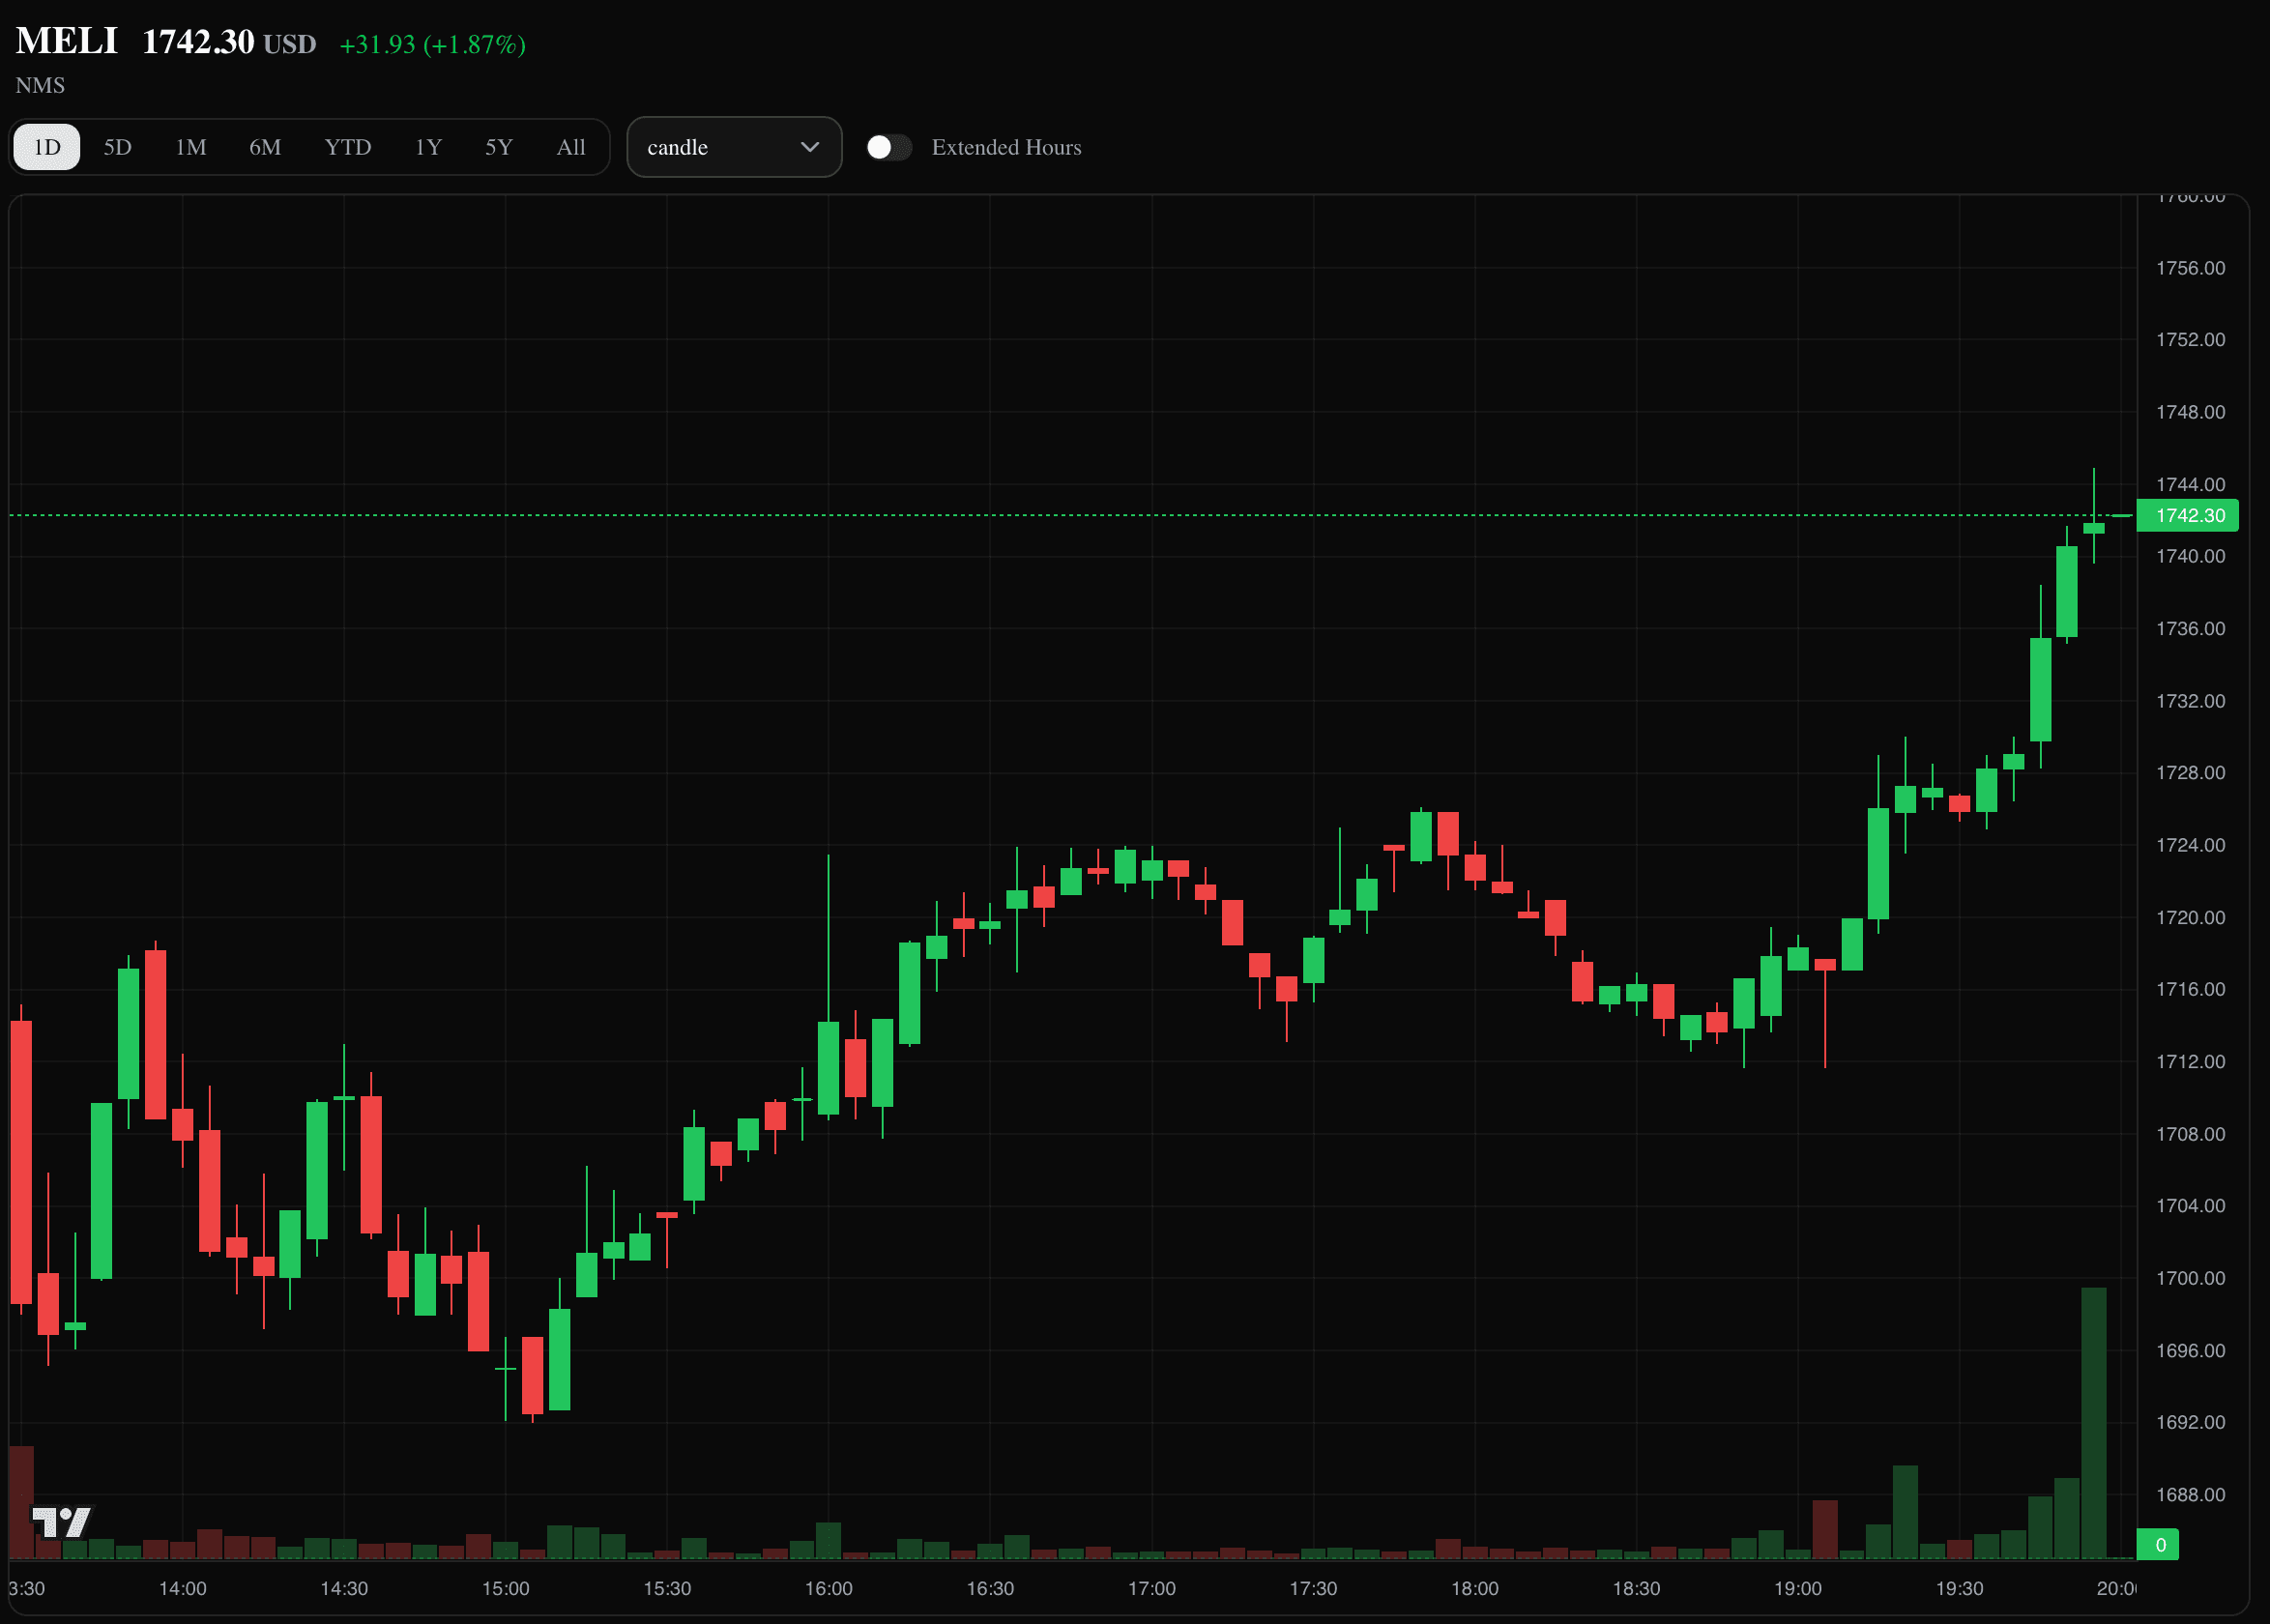
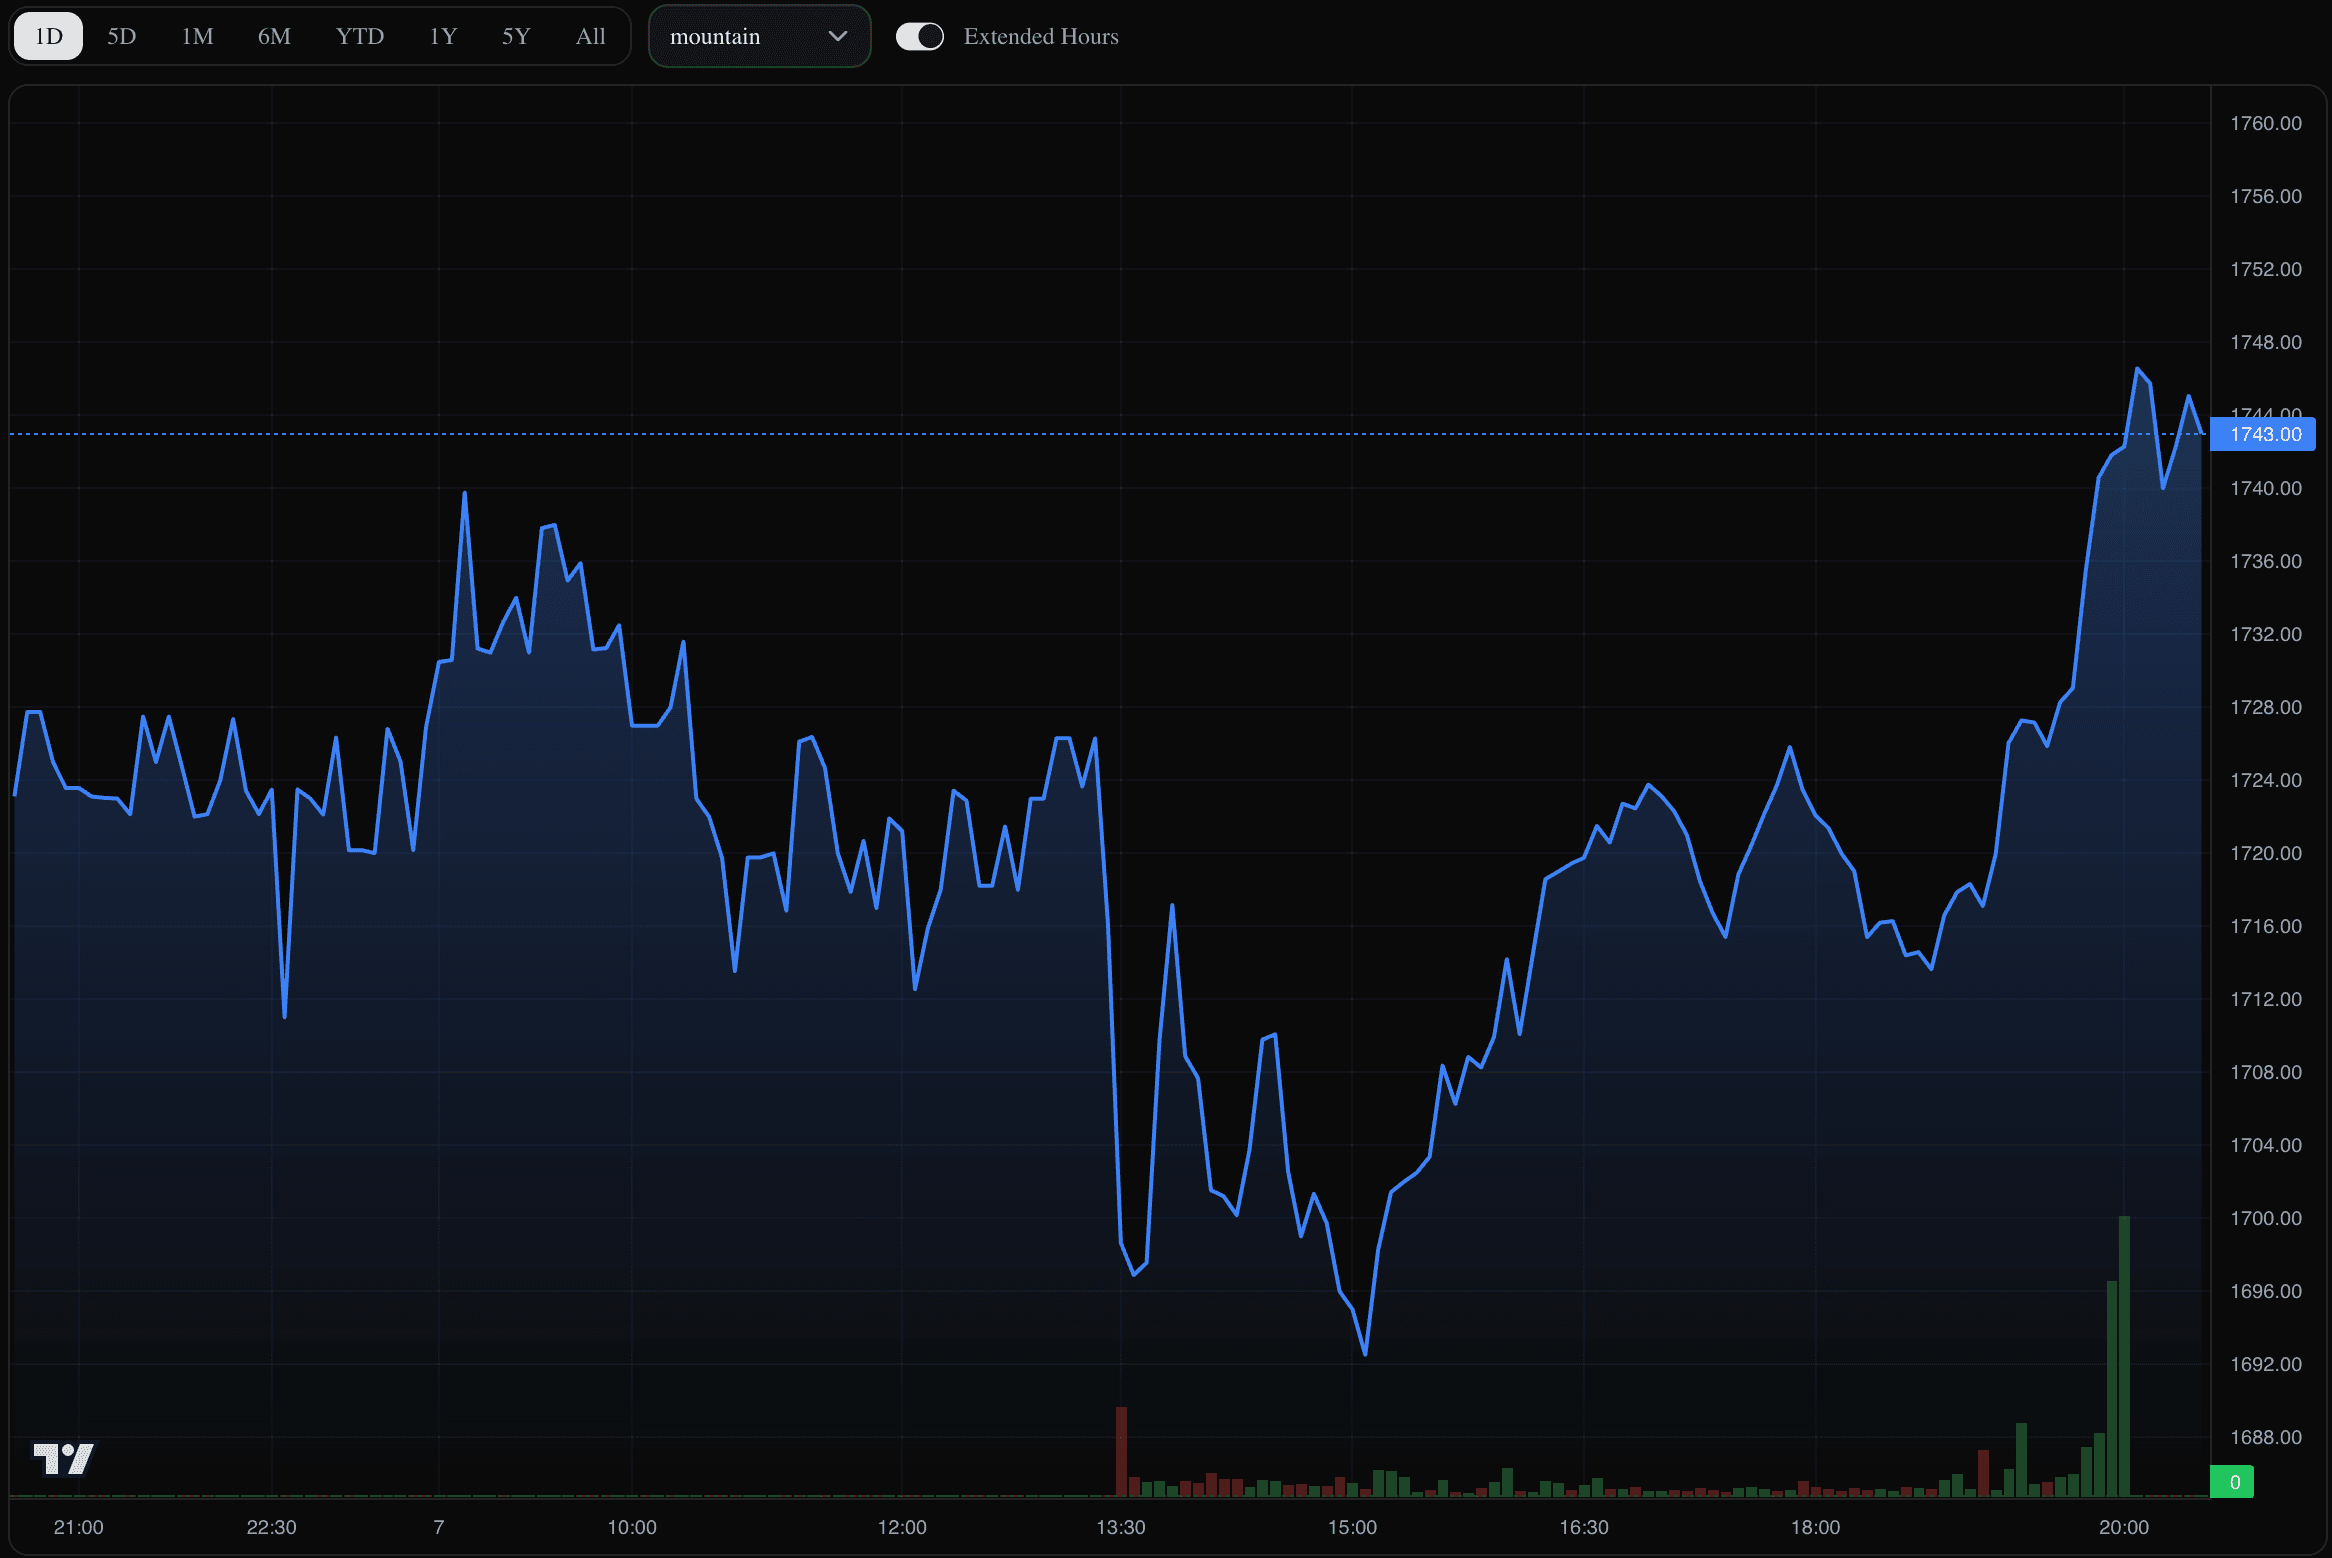
Professional-Grade Visualisation
Built on Lightweight Charts for a fluid 60 fps experience. Users can switch between Candlestick, Area (Mountain), and Baseline views, with full support for extended hours (pre-market & after-hours) data.
Forward Fill Data Engineering
Unlike conventional scrapers, this system guarantees statistical integrity. It applies the Last Value Carried Forward technique to handle non-trading days — holidays and illiquid sessions — ensuring that return and volatility calculations in Excel are methodologically sound.
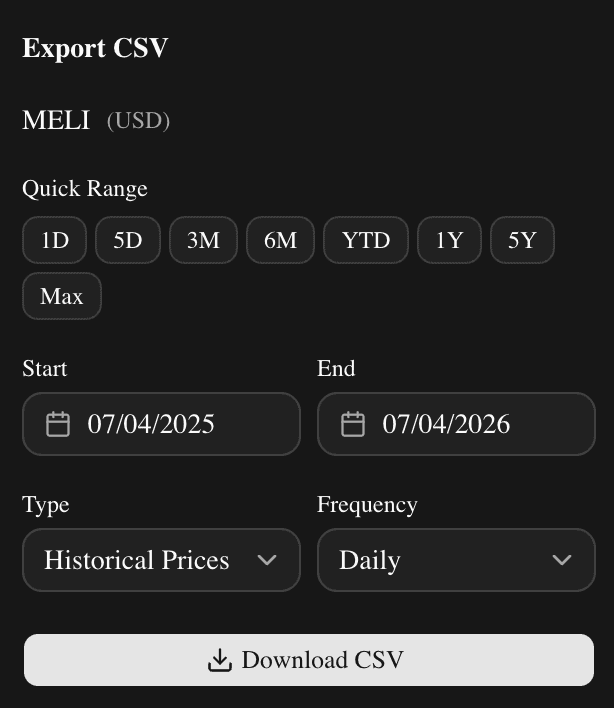
Excel-Ready Export Engine
A download engine that resolves the most common encoding headaches. CSV files are generated with UTF-8 BOM injection and ISO date formatting, so they open perfectly in any regional Excel configuration — no manual cleanup required.
Screenshots
Architecture & Technical Value
The project was built with Next.js, TypeScript, and Node.js. Its defining architectural decision is a shared-state panel: a sidebar of precision tooling — interval selectors, chart-type toggles, extended-hours switch, and export controls — that drives a dynamic visual canvas in real time without any page reload.
This architecture keeps the UI snappy while maintaining a clean separation between data-fetching logic (server-side API routes) and the presentation layer. It's a project where Software Engineering is deliberately placed in service of Financial Science.